easternbun
CAD practitioner
Would someone be kind to point the file of the triangulation algorithm implementation code?
#include <iostream>

#include <BRepMesh_IncrementalMesh.hxx>
#include <valgrind/callgrind.h>

#include <ocsall.h>


// run with:
// valgrind --tool=callgrind --instr-atstart=no ./occtCallGraph
int main(int, char**)
{
  auto fileShape = ocs::readBRep("~/cadseer/media/mm2021.brep");
  assert(!fileShape.IsNull());
  BRepTools::Clean(fileShape);
  CALLGRIND_START_INSTRUMENTATION; //skipping code before this
  BRepMesh_IncrementalMesh mesher(fileShape, 0.01, Standard_False, 0.5, Standard_True);
  CALLGRIND_STOP_INSTRUMENTATION; //skipping code after this
  CALLGRIND_DUMP_STATS;
  return 0;
}exactly what I need, I do see delaun, so I guess this may be it.Tracing around OCC can be a real challenge with all the virtual dispatch. I ran the following code and created a dynamic call graph. Maybe that will help you track down what you are interested in.
C++:#include <iostream> #include <BRepMesh_IncrementalMesh.hxx> #include <valgrind/callgrind.h> #include <ocsall.h> // run with: // valgrind --tool=callgrind --instr-atstart=no ./occtCallGraph int main(int, char**) { auto fileShape = ocs::readBRep("~/cadseer/media/mm2021.brep"); assert(!fileShape.IsNull()); BRepTools::Clean(fileShape); CALLGRIND_START_INSTRUMENTATION; //skipping code before this BRepMesh_IncrementalMesh mesher(fileShape, 0.01, Standard_False, 0.5, Standard_True); CALLGRIND_STOP_INSTRUMENTATION; //skipping code after this CALLGRIND_DUMP_STATS; return 0; }
That was my guess also, as I very briefly scanned the graphviz file.exactly what I need, I do see delaun, so I guess this may be it.
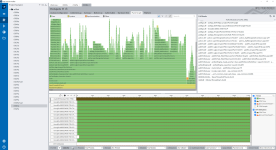
Yes! a flame graph is a much nicer visualization than graphviz. If I ever work on my tool again, I will look into generating flame graphs. I used graphviz, as it is 'baked' into boost graph.@blobfish Interesting approach, indeed. I sometimes do the same with VTune Amplifier on windows, they have a nice "flame chart".
Hey, what, have you given up with cadseer? Or have you rather finalized it more or less?If I ever work on my tool again...

No, I am still working on cadseer. I was referring to the tool that I used to generate the graphviz file from the callgrind output. Sorry for the confusion. I do find myself spending more time on opencascade than cadseer these days. Working on cadseer feels like I am trying to shingle the roof before the foundation cement has cured.Hey, what, have you given up with cadseer? Or have you rather finalized it more or less?
So your usage of VTune has been primarily for 'hotspot' detection? Next time I want a call graph I will check it out.Normally, I attach VTune to the process, and it stays idle while I'm preparing for testing. It is often just one function that I run from Tcl or C++ (as a unit test). Once prepared (i.e., the CAD model is loaded and I'm ready to fire the algorithm), I click "Run" and let it do its magic. In most situations, the output is clean and concise, so it does not require any further work except for your own thinking and figuring out what's going on in the code.
From time to time, I run Amplifier preventively on the entire test grid for a specific algorithm just to discover its implicit bottlenecks, which are sometimes not obvious at all (especially after several years of maintenance). So many times I was staring at BRepBndLib eating 90% of execution timeIt really gives a good perspective on what you ended up with and what the contribution of each algorithm's stage is.
What is your current focus on OpenCascade? Just curious.I do find myself spending more time on opencascade than cadseer these days.
Yep. I also tried some of its extra tools (Adviser or whatever it was called), but the effect was almost nothing. For hunting down memory leaks, I still have nothing better than diagnostic macros spread over the code base. It feels pretty much like I'm in the stone age with profiling memory usage, but, to be fair, I've never taken the time to sit down and read about best practices for solving such problems.So your usage of VTune has been primarily for 'hotspot' detection
I have been spinning my wheels in the offset api. I will make a new post as not to further hi-jack this thread.What is your current focus on OpenCascade? Just curious.
Welcome to my world.For hunting down memory leaks, I still have nothing better than diagnostic macros spread over the code base. It feels pretty much like I'm in the stone age with profiling memory usage, but, to be fair, I've never taken the time to sit down and read about best practices for solving such problems.
