Imperative plotter
Motivation
The imperative plotter (or visual debugger) is the abstract interface available together with a progress notifier in all algorithms of Analysis Situs. This interface is designed to easily dump geometric primitives in cout-like manner right into a 3D viewer for fast check of the state of your algorithms. The necessity to have visual debuggers is very well understood by the computer graphics community and by anyone who ever implemented any non-trivial geometric computations. Just like having all sorts of "Watch" views or printing diagnostic outputs, the availability of a plotter to dump your geometric primitives is indispensable for understanding computation flow and debugging.
The idea of imperative visualization assumes that at an arbitrary stage of the algorithm, any geometric primitive involved in it can be displayed for profiling. An example of imperative visualization logic is presented in a pseudo-code below:
{
  // ...
  // Here goes some code to build two surfaces S1 and S2
  // ...

  IV.DRAW_SURFACE(S1)
  IV.DRAW_SURFACE(S2)

  // ...
  // Here goes some code to intersect two surfaces S1 and S2
  // ...

  IV.CLEAN
  IV.DRAW_CURVE(intersection_curve)
}
In the above snippet, object IV represents a plotter. It makes sense to keep imperative calls even if profiling is disabled. This way, you ensure that during the maintenance phase, you will have all necessary diagnostic dumps in your code.
Unlike general visualization workflow, the imperative plotting does not bother you with such notions as a scene tree, the lifecycle of your rendered primitives, and their states. Programmatically, to draw a primitive from the algorithm should be as easy as to print a diagnostic message. On the other hand, the actual implementations of the plotter interface may use any internal structuring of the visualized objects and maintain their properties so that you may change them later on. A good imperative visualization should simulate a whiteboard where you can draw and erase whatever you want at any moment of time. It gives you essentially a cognitive visualization tool which significantly speeds up the development and debugging routines.
The abstract interface of imperative plotter declares the methods like DRAW something and REDRAW something. It is assumed that the DRAW-methods create new visualization primitives while the REDRAW-methods update the existing ones (or create them if such primitives are not yet available). The primitives are identified by their names.
Attributes, such as color or transparency, are not configured separately, but are specified for each object individually at the time of drawing. Thus, the "brush" metaphor is not used here to relieve the imperative principle from having any sort of "memory". All properties of the visualized primitive should be fully defined by the arguments of a drawing call. The use of naming makes the profiled algorithm "speak its own language" which is defined as a set of variable names that might be dumped into explicit geometric representations.
Implementation
The abstract interface of imperative plotter is declared in ActAPI_IAlgorithm class which is a part of Active Data framework. The algorithms of Analysis Situs inherit from this base class to take advantage of the imperative plotting services.
The implementation of the imperative plotter interface in Analysis Situs is available in its asiUI_IV class (IV = Imperative Viewer). This class overrides all virtual methods of an abstract plotter and delegates the visualization job to VTK visualization. The visualization mechanics of the imperative plotter fully respects the common visualization architecture. Each dumped primitive corresponds to a data object stored under the common root of asiData_IVNode class. There are several predefined Node types corresponding to all commonly used primitives:
- Point set: asiData_IVPointSetNode.
- Point set 2D: asiData_IVPointSet2dNode.
- Curve: asiData_IVCurveNode.
- Curve 2D: asiData_IVCurve2dNode.
- Surface: asiData_IVSurfaceNode.
- Tessellation: asiData_IVTessItemNode.
- B-Rep model: asiData_IVTopoItemNode.
- Text: asiData_IVTextItemNode.
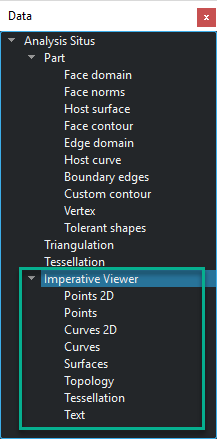
All Nodes representing the IV primitives are available in a dedicated section of the project tree. Therefore, the user is able to manipulate with these primitives if necessary.
The imperative plotter is another tool from a gentleman's set of a computational geometer. In essence, this is more of a practice, the adherence to which helps in the development and maintenance of industrial algorithms.